Autocator Web App — My Project Analysis
This is an article detailing my contributions to the Ada Collab 2 Hackathon.

Machine Learning Engineer • Technical writer • Mechatronics Engineering Undergraduate
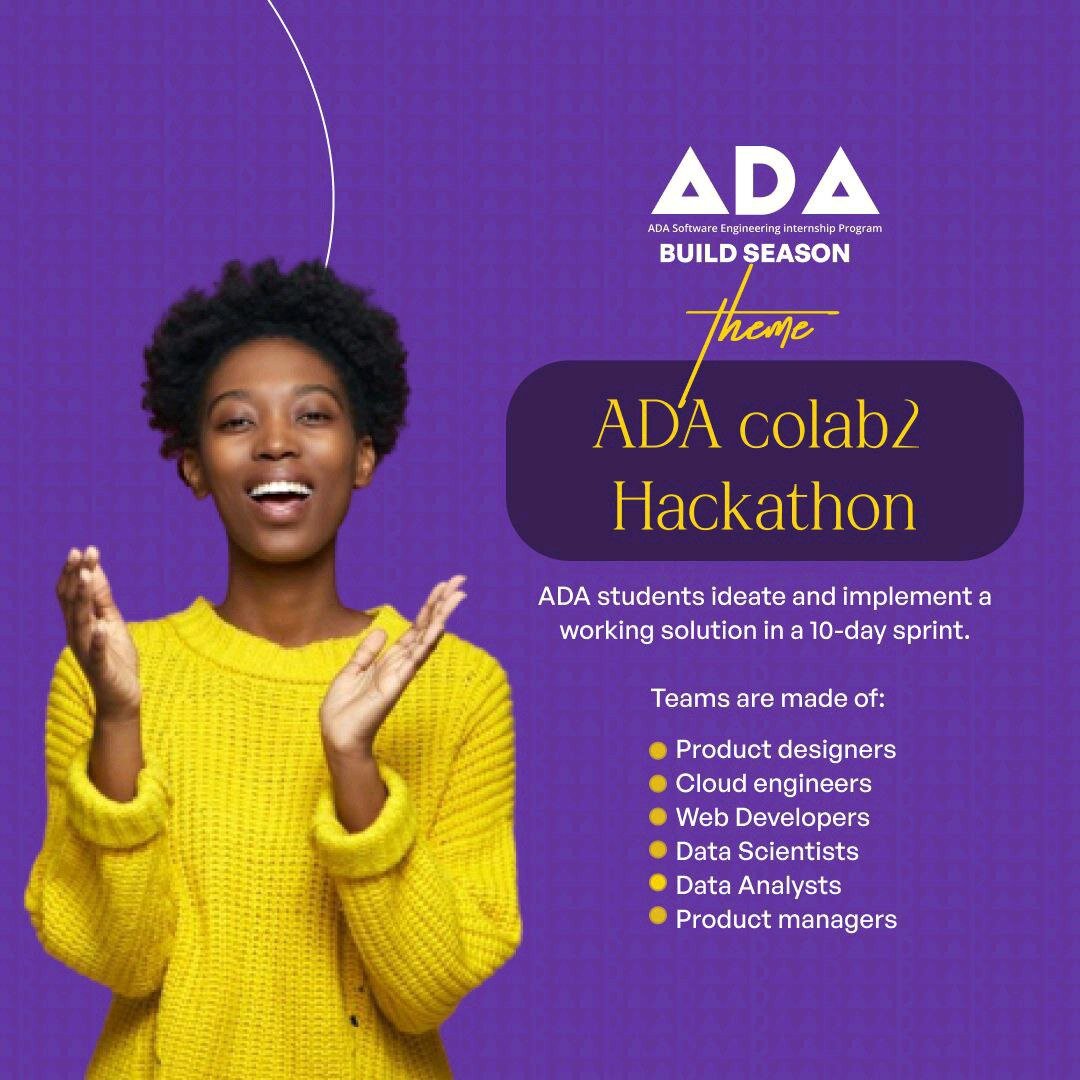
The Ada Software Engineering Internship Programme is a 7-month BootCamp powered by the Enugu State Tech Hub. It aims at upskilling Nigerian women with the necessary skill set to pursue a career in tech. As a person that fits the criteria, I signed up and got into the first-ever cohort of the programme.
In a bid to make us job-ready and to have projects to upload on our portfolio, we are currently on the second collab project in the programme. This is the third of four project sprints in total, and there are eight teams in the current project sprint. My team and I were tasked with creating a platform where car owners would be able to connect with a credible and genuine repairperson for their faulty vehicles in their location. In this article, I talk about my role as a data scientist on the team, in bringing the product to life.
Introduction to the Project
An ideation session was held for the students in the BootCamp where we would think about problems and suggest solutions to them. Each student was put in a group and given a problem to design a solution to. I was a member of Team Amadioha, and we were tasked with developing a web application where car owners can access quality and credible repair persons, regardless of location. This gave birth to our product — Autocator — A web app for solving the identified problem. We only had ten days to build this project and ensure it was functional to a great extent.
Features I Worked On
As the data scientist on the team, I worked on the chatbot for the web application, and I conducted a small analysis of the product. My technical writing skill also came in handy as I wrote the Technical Requirement Document (TRD) for my team, and helped our Product Manager with writing the Product Requirement Document. I talked about how I did these in more detail below.
Chatbot
A major requirement all projects had to have was a chatbot. This is something I had not built before, nor did I think I could as I have very basic Python knowledge. I learnt thanks to the project and my facilitator, Mr Eliel Godsent, that no-code tools such as IBM Watson Virtual Assistant, Google Dialogflow, and Tiledesk were available to do this.
For Autocator, I made use of IBM Watson Virtual Assistant. It was really easy to use and integrate into the website. The user interface was also easy to understand. The YouTube video below was of immense help in guiding me to use the platform. I was able to build a fully functional chatbot that met my product requirements.
I also created a document that contained the use case scenario of the chatbot, and the logic flow for each use case.
Data Analysis
To get a sense of how accepting potential customers will be of our product and how successful the product will be, we created a survey.
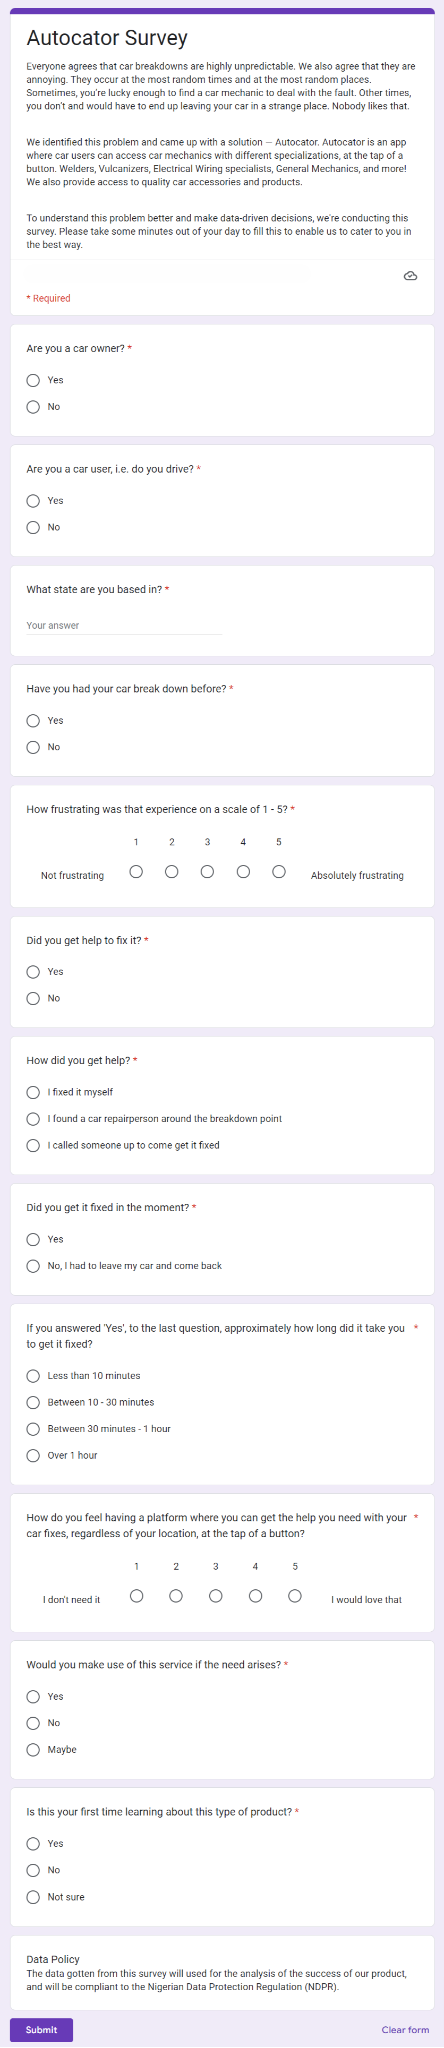
After seven days, the survey got 35 responses, and the analysis was conducted.
Data Collection
The survey was our source for collecting data. This was because the data needed was unique to our product and couldn't be gotten from an external or pre-existing source. I also assured the respondents that their data would be used under the Nigerian Data Protection Regulation (NDPR). You can learn more about this from the article I wrote on data laws.
Data Cleaning
The dataset didn't require heavy data cleaning as the survey form already had the needed answers, and all the respondents had to do was pick. That did not eliminate the data cleaning process, as I carried out the following:
Confirm the conditions for filling out the form: The survey had two major questions, "Are you a car owner?" and "Are you a car user?". To ensure that the responses we got were from the needed market, I checked the dataset and removed the entries that had answers to the two questions as "No". One question needed at least one "Yes" as a response. I did this through the following steps:
First, I inserted my dataset into a table.
Next, I applied filters to the two columns where the responses were "No".
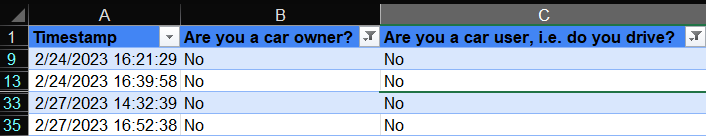
A total of 4 out of the 35 responses were returned and then deleted from the dataset.
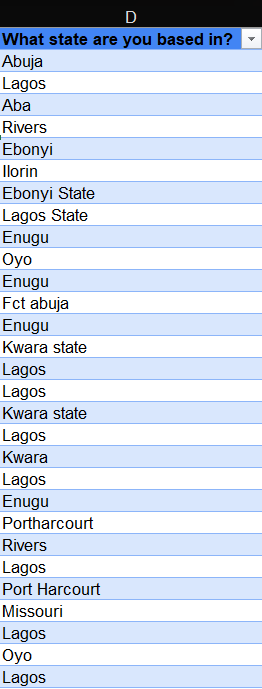
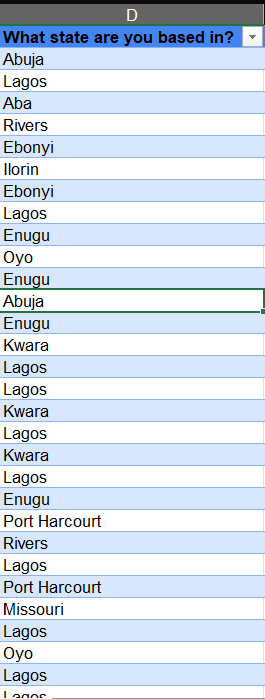
Clean the 'What state are you based in?' column: This column didn't have a set of options for the respondents to choose from, so it required cleaning. Some responses had the word 'state' after the name of the state had been typed, and that wasn't needed. Some were incorrectly filled like 'Fct abuja'. 'Port Harcourt' also had different spelling variations.
To fix these, I split the text into columns to remove the 'state' from the responses. The following explains the steps I took in detail:
I selected the column I needed to split excluding the column header.
I clicked on Data, then Text to column, in the ribbon. The following prompt popped up.
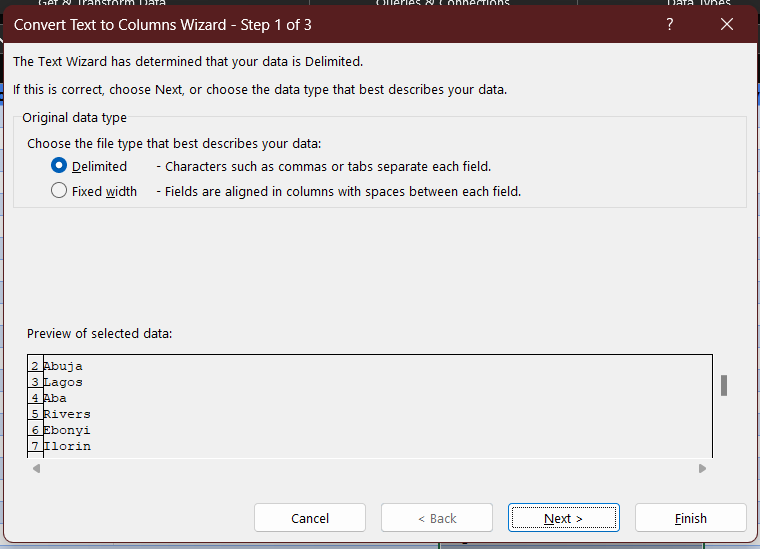
The entries are delimited. That means a character separates the entries. This is called a delimiter, and it includes 'Semicolon', 'Tab', 'Comma', 'Space' and more, as you'll see below. In my case, it is a space. I select that option and then click on 'Next >'.
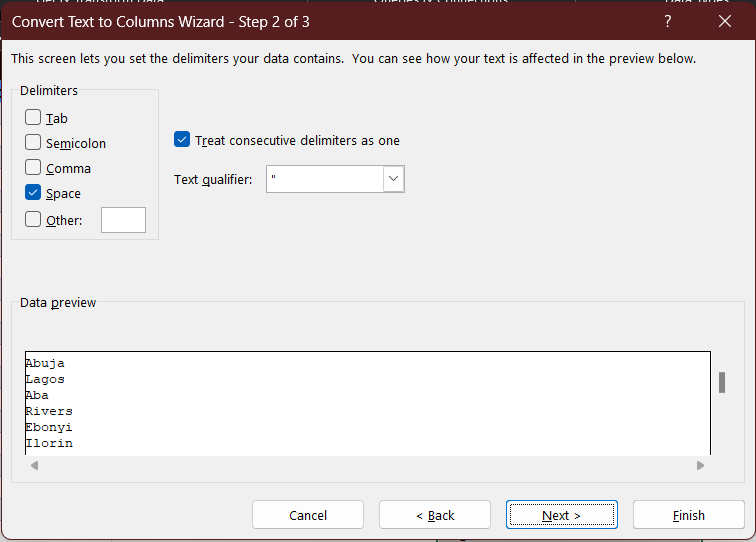
As previously stated, I select the 'Space' option, as that is the delimiter. I click on 'Next >' again, and I'm given a preview of what the column will look like. I hit 'Finish', and the text is successfully split. The result is displayed below.
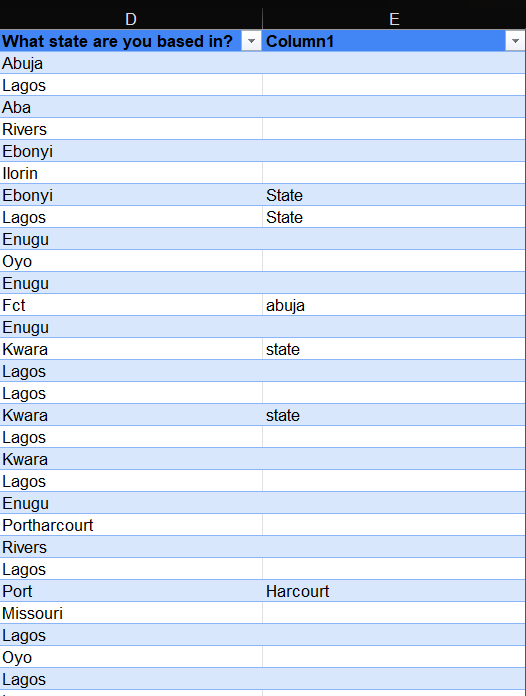
Finally, I went ahead to delete the column I didn't need.
- Edit misspelt states: After splitting the columns, I use the 'filter' to confirm that the data values are correctly spelt.
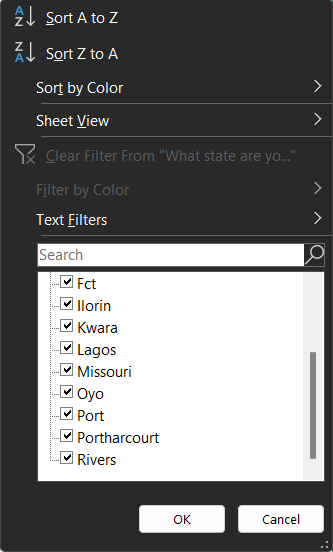
The 'Fct', 'Port', and 'Portharcourt' entires need editing, which a simple 'Find and Replace' can fix. A shortcut for accessing this feature is by typing 'Ctrl' + 'H', and then the prompt comes up:
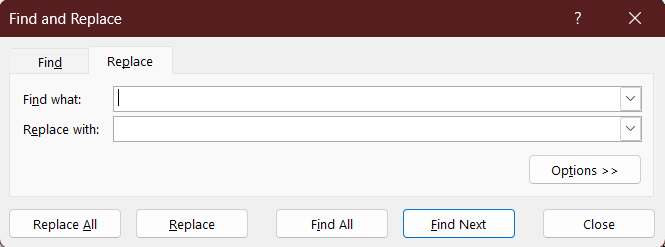
Now, I type the states I want to edit in the 'Find with' bar and the expected format in the 'Replace with' bar. I make the necessary changes, and the column is how we want it to be.
Editing Blank cells: After applying filters, I find that one column has a blank cell, that is, a missing value in the "Are you a car user?" column. Before deleting the cell, I investigate why the cell is blank. I learnt that it was not a required field in the survey form at some point. Hence, the respondent skipped it. To deal with this, I deleted the entry because the responder doesn't own a car based on our "Are you a car owner?" column, and one of the two has to be a "Yes" to be a valid entry.
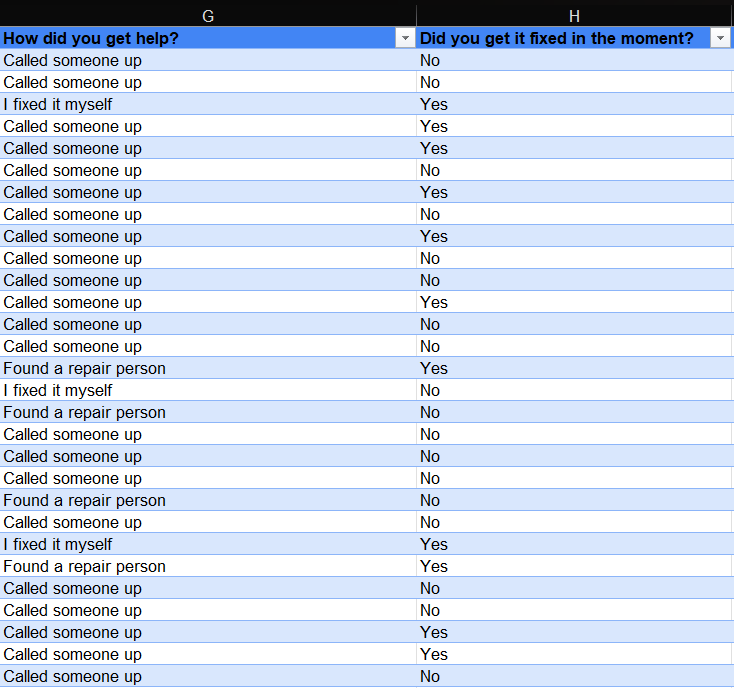
Summarize responses: The next step is to shorten/summarize some of the data points so that our analysis is easy to comprehend. Our dataset looks like this:
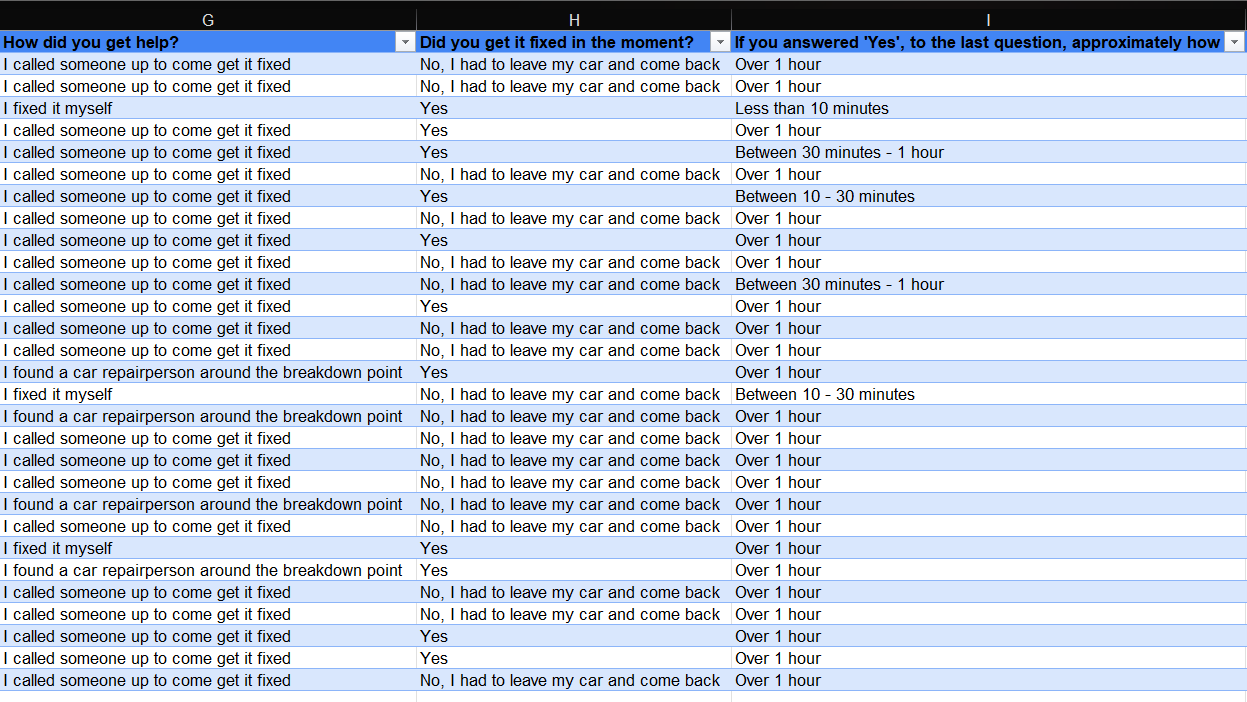
The sentences are too long and would compound our dashboard. So, by using the 'Find and replace' feature, I shorten the responses while ensuring that the edit is not different from the responses in my dataset.
- Confirming data types: The last step in my data cleaning process was to ensure that all my data columns had the correct data type for the value contained.
Data Analysis
At this stage, I can now answer questions needed to solve our problem based on the dataset. To guide my analysis, I asked seven questions:
How many people use cars and/or own cars?
Amount of people that have experienced a car breakdown.
States with the most car breakdowns.
How long it took to repair the car?
How was the car fixed?
Amount of people open to using the service.
To answer these questions, I created a new worksheet in the workbook and made pivot tables for each analysis.
Data Visualization
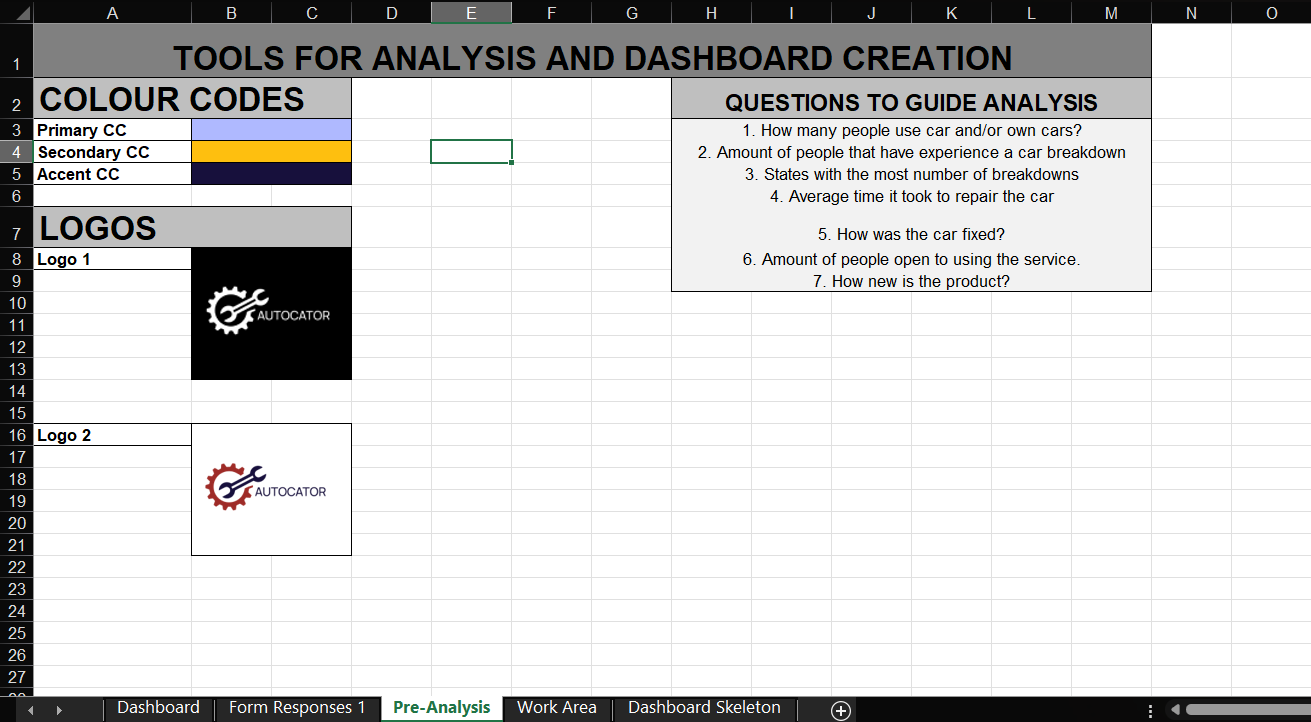
This is the stage where designing a dashboard to convey your findings to stakeholders happens. Before designing, I created a worksheet that contained the extras I'd need:
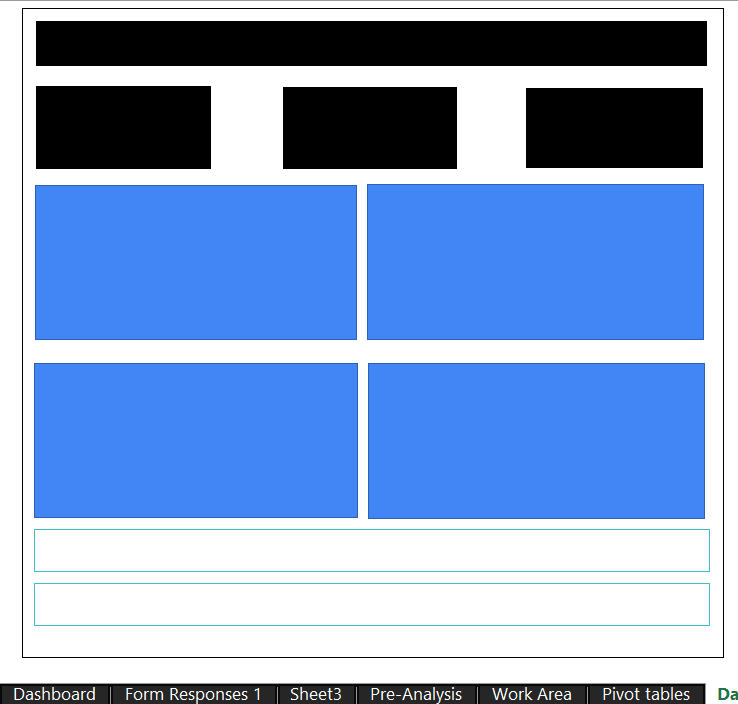
I also sketched a layout of how I wanted the dashboard to turn out:
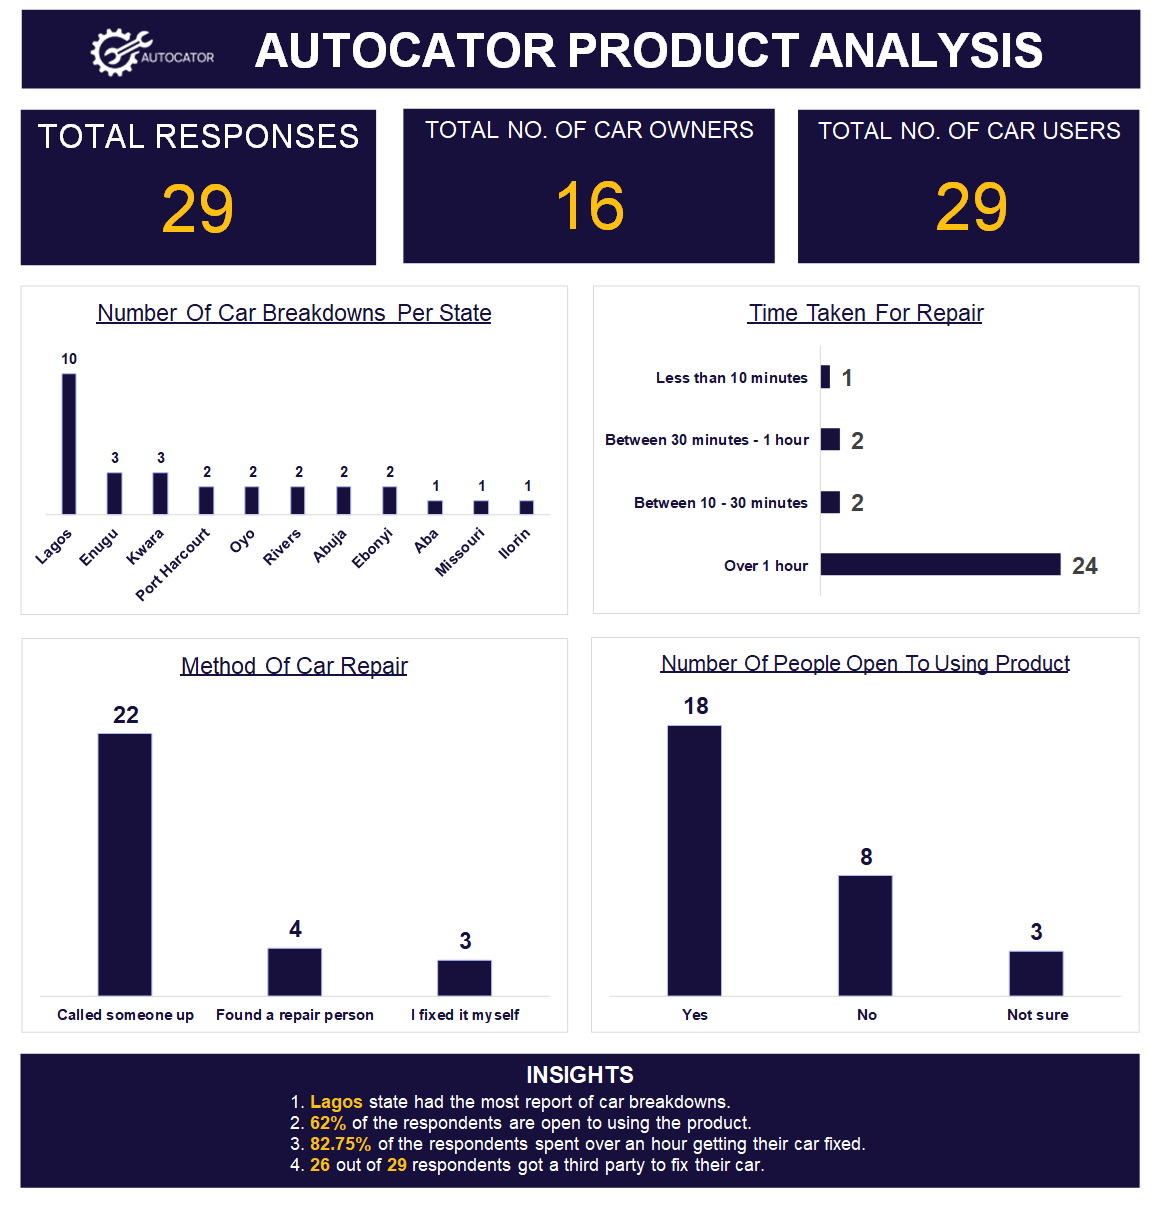
This is how my dashboard turned out:
TRD
This product was my first means of learning about a TRD. It is a document that contains all the technical information about a product. This includes the web or app architecture, the programming languages used, the types of APIs to be integrated...and more. To create this document, I used Gitbook, and this was also my first time doing so.
You can click the image below to access the TRD.
What I Learnt
I had a lot of firsts thanks to this hackathon; my first time creating a chatbot, my first time writing a TRD, my first time using Gitbook, my first time documenting my analysis process...a lot! It was tough initially but worth it, as I pushed myself to learn what I needed to make the product execution successful. I skilled up during the hackathon and became a better person than I was going in. I also got to collaborate with a team for the second time, which helped me build my teamwork and collaborative side.
What I Look Forward To
After this hackathon, I plan to collaborate on more projects to help build my data science and technical writing skill. I also hope to share the knowledge I acquired to guide other people to achieve the same things I did and more.
Conclusion
The Ada Collab 2 Hackathon was a blast! It helped me improve my problem-solving skills, my technical skills, and my soft skills. I designed a chatbot, worked on a small product analysis and published a TRD.


